Has GBP Trading Changed?
The coronavirus crisis has caused the most turbulent year for financial markets in decades, putting pressure on currencies across the globe. However, with the continuing uncertainty surrounding Brexit the pound faces some unique challenges (chart 1).
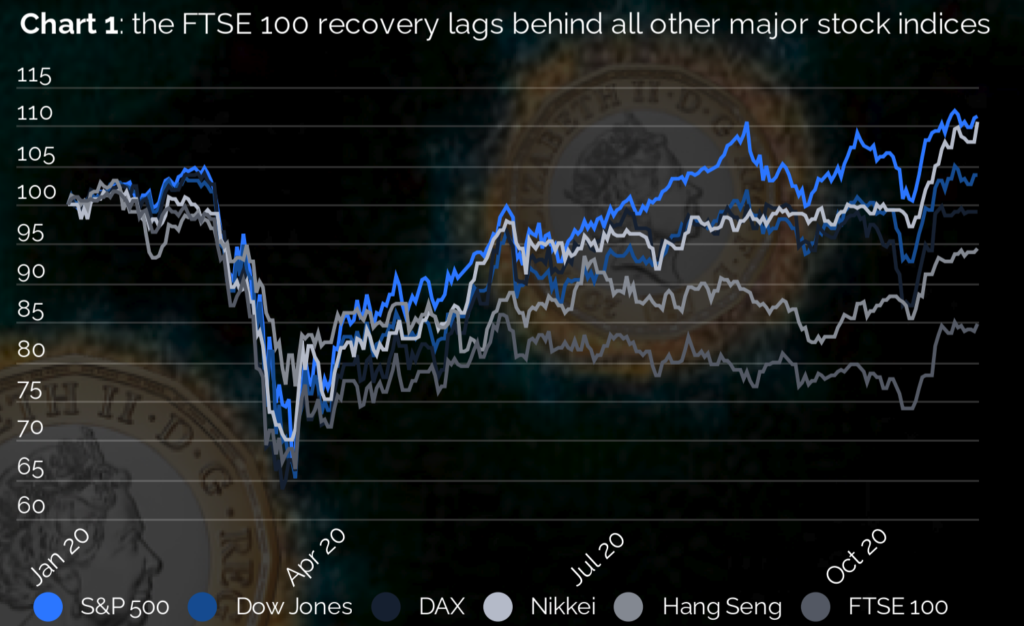
Shining light on investor sentiment with CLS FX Spot Flow
Have the twin shocks of Covid and Brexit uncertainty permanently altered the perception of GBP and changed investor buy / sell sentiments towards the pound? Using CLS FX Spot Flow data we can get a clear insight into global investor perceptions of the pound by analysing the net imbalance of buy and sell volume for banks and funds between the pound and its major trading partners.
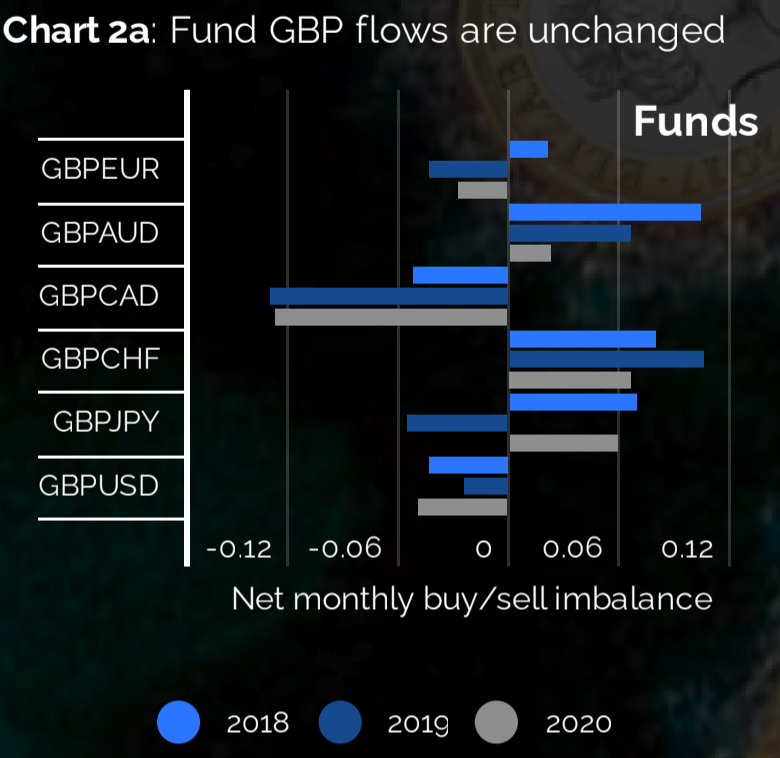
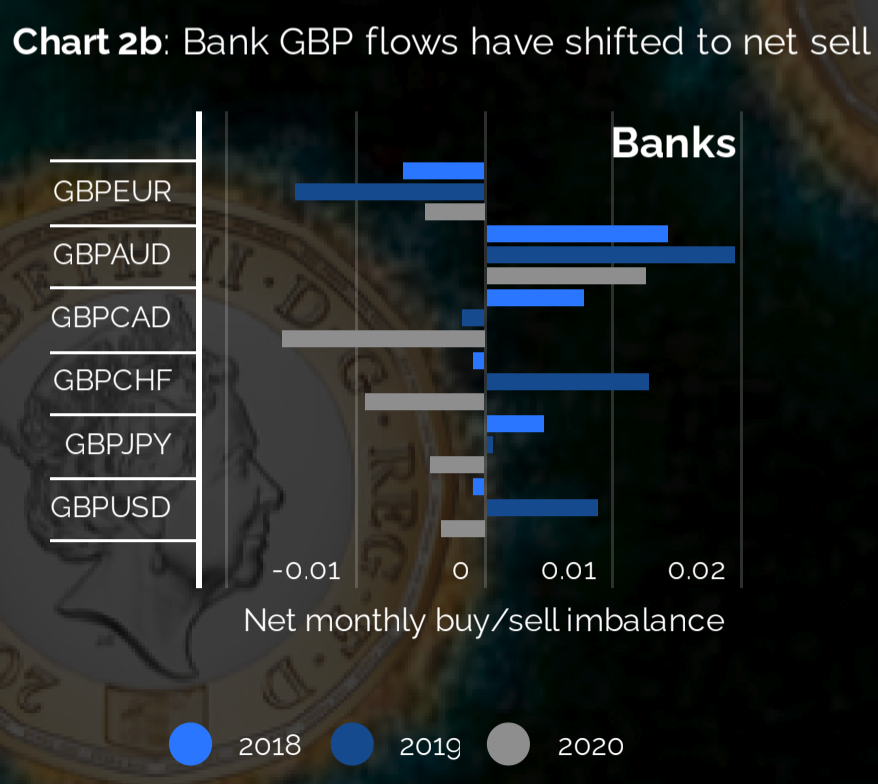
The bars show the average monthly buy minus sell spot volume as a fraction of the monthly total for March through October of each year.
Let’s focus on funds (chart 2a), as they are considered to be “informed investors” who trade currencies primarily as speculators hunting profits rather than risk-hedging banks of corporates funding day-to-day operations.
The picture has not markedly changed since the Covid pandemic. Against all the pound’s major trading partners except the Yen, the investor flow follows the same course as last year, even in some cases shifting slightly towards the net buy direction, although this shift is far from statistically significant.
The conclusion is that money managers’ views of GBP have Covid immunity.
The same cannot be said for banks (chart 2b), where we see an increased sell pressure relative to 2019 in all crosses except GBP / EUR.
Gauging liquidity with FX Sport Volume from CLS
One of the salient features distinguishing an established currency from an emerging one is liquidity. If GBP were truly losing stature amongst the majors it would be slipping in the liquidity tables. Using CLS FX sport volume data we can see how GBP fares in the rankings (chart 3).
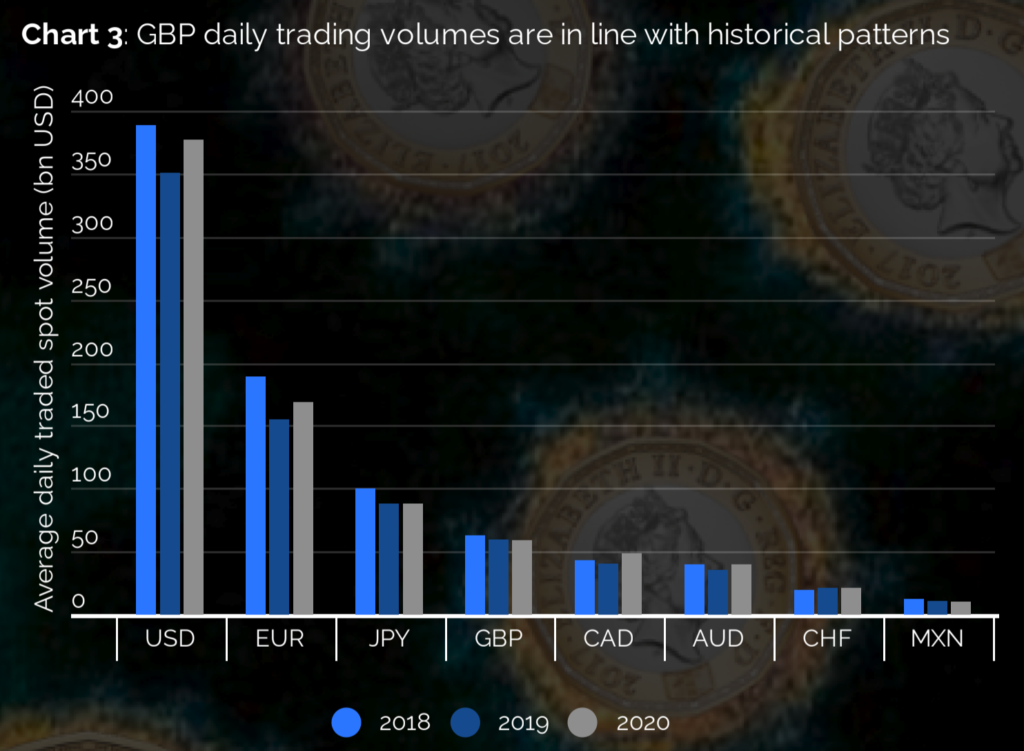
The pound still occupies the 4th spot in the volume league table. Despite the surge in USDCAD trading in 2020, the pound’s daily liquidity has barely changed since last year, remaining firmly ahead of commodity currencies like AUD and CAD along with emerging market currencies like MXN.
A diminished-stature pound may be a convenient headline for op-ed writers but does not reflect the realities of the FX market.
Spotting trading regimes with causaLens changepoint detection
Going beyond eyeballing charts we can systematically detect if there was a regime shift in spot trading volume at the onset of the Covid pandemic by leveraging causaLens proprietary changepoint detection algorithm (chart 4).
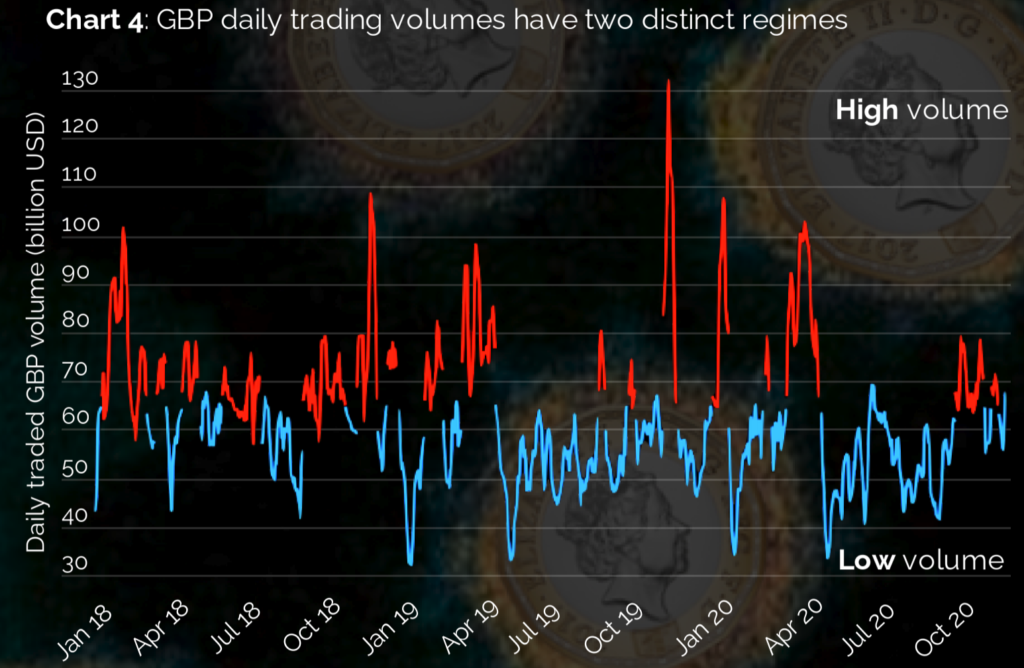
For GBP we can see two regimes characterised by below average and above average volume. Volume has mostly been in line with historical values since the Covid panic of Feb- Mar 2020. The recent uptick in September is driven by GBP / USD volume trading and may be due to UK investors purchasing US equities amid renewed stock market optimism.
Summary
Obtaining volume data on FX transactions is challenging due to the decentralised, fragmented nature of FX markets. Using causaLens predictive technology with CLSMarketData allows analysts to systematically uncover new insights in FX markets.