Causal AI modeling for Time Series Data
Working with time series requires particular attention.
Our platform helps data scientists efficiently address the nuances of working with time-series data across the modeling pipeline.
Below, we provide a high-level overview of the time-series specific features we have developed.
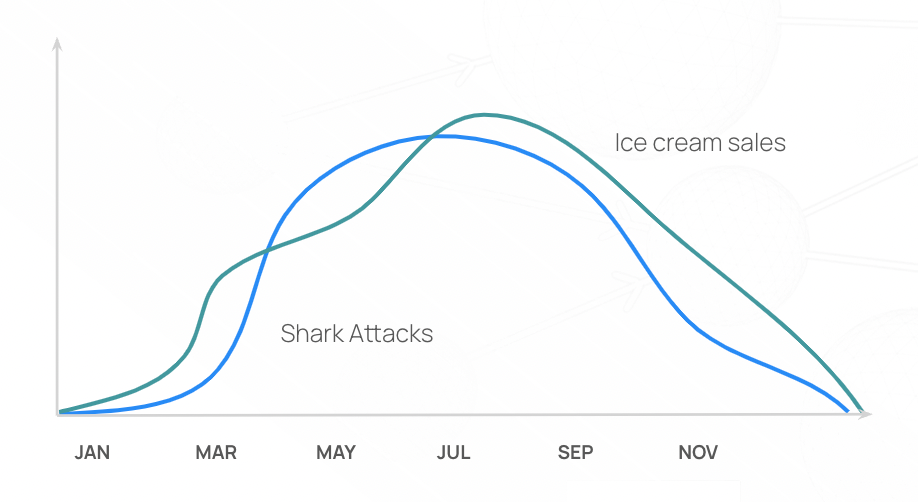
Quickly discard spurious correlations
- Leverage 10+ causal discovery algorithms to select raw and/or transformed features while quickly filtering spurious correlations. Data Scientists have full control over the causal discovery algorithm configuration, such as conditioning sets and scoring functions.
- Stationarize, scale, extract seasonality, impute missing values, and create transformed time-series features (returns, differences, moving averages, z-scores, etc.) in a few lines.
- Create interactive & cross-sectional features or even your own custom ones.
Discover cause-effect relationships
- Use a mix of domain expertise and algorithmic causal discovery to discover the discover the causal structure within multivariate time-series or panel datasets.
- We have put together the richest library of causal discovery algorithms for time-series data.
Unfortunately, most commonly-used causal discovery algorithms are not suitable for time-series data due to auto-correlations.
Our platform provides both constraint-based & continuous optimization causal discovery algorithms that take natural temporal ordering into account. - We are constantly addressing scalability issues.
a. Computation can be flexibly deployed in a distributed system setting
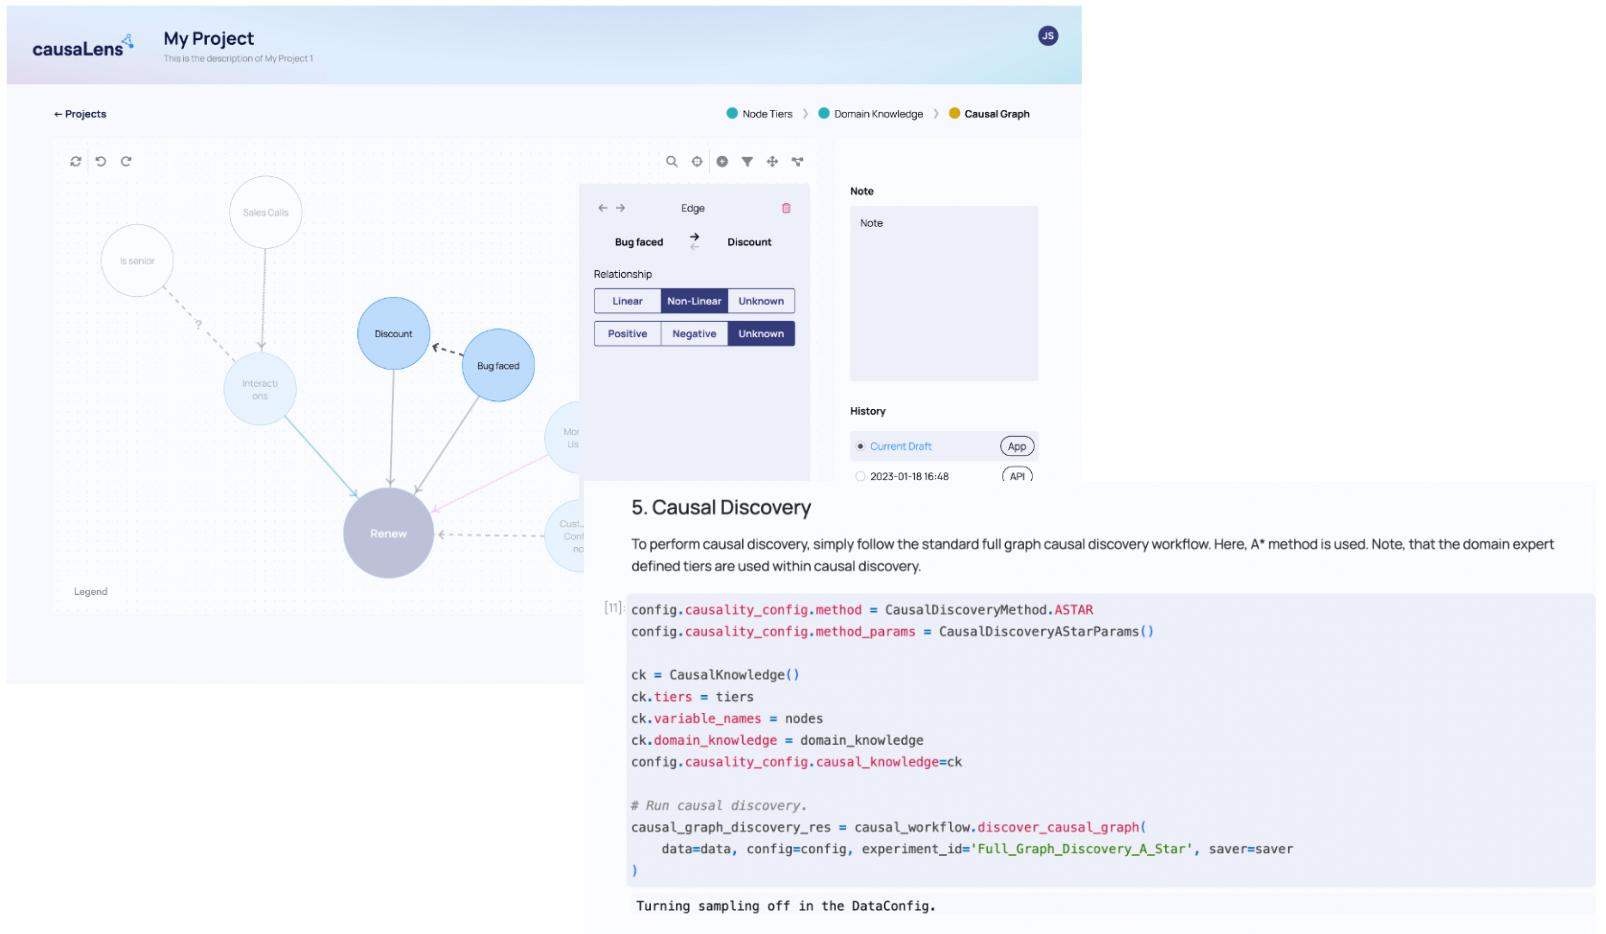
b. We make it easy for our users to use a number of approaches to reduce the search space including coarse-to-fine approach, hyper-parameter optimization, embedding more domain-knowledge as well as searching locally. You can read more here. - Leverage our intuitive, out-of-the box, human-guided causal discovery app to embed domain knowledge yourself or just ship the app to business users.
Creating causal hierarchies (Tiers) as well as direct edge resolution are the most typical approaches.
Causal Graph Vizualizations specifically made for time-series
We have expanded our open-source causal graph library to include native support for time-series data.
Open source project is here.
Highlights:
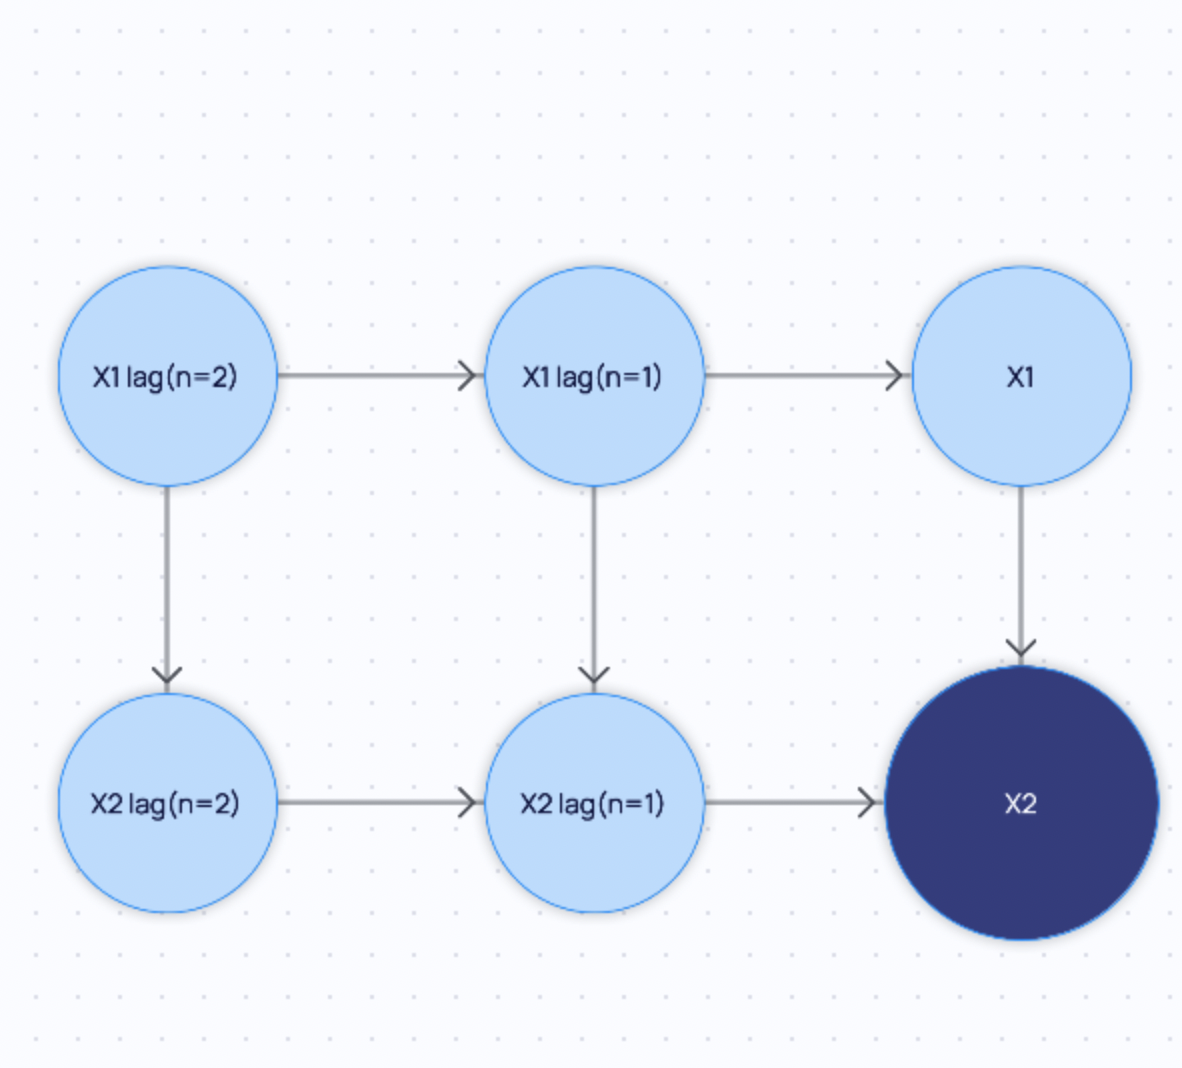
- Easily create time lags within a causal graph and capture time-based causal effects.
- Extend the graph backward and forward in time multiple steps, allowing the user to set the appropriate memory for the model.
- Guardrails to prevent users from adding directed edges that go backward in time, ensuring that the graph actively avoids lookahead bias.
- Easy conversion traditional causal graph into a time-series causal graph with just one additional line of code. This will provide host of utility methods, and the subsequent operations will respect the time-based ordering of the graph.
Build structural causal models that robustly predict
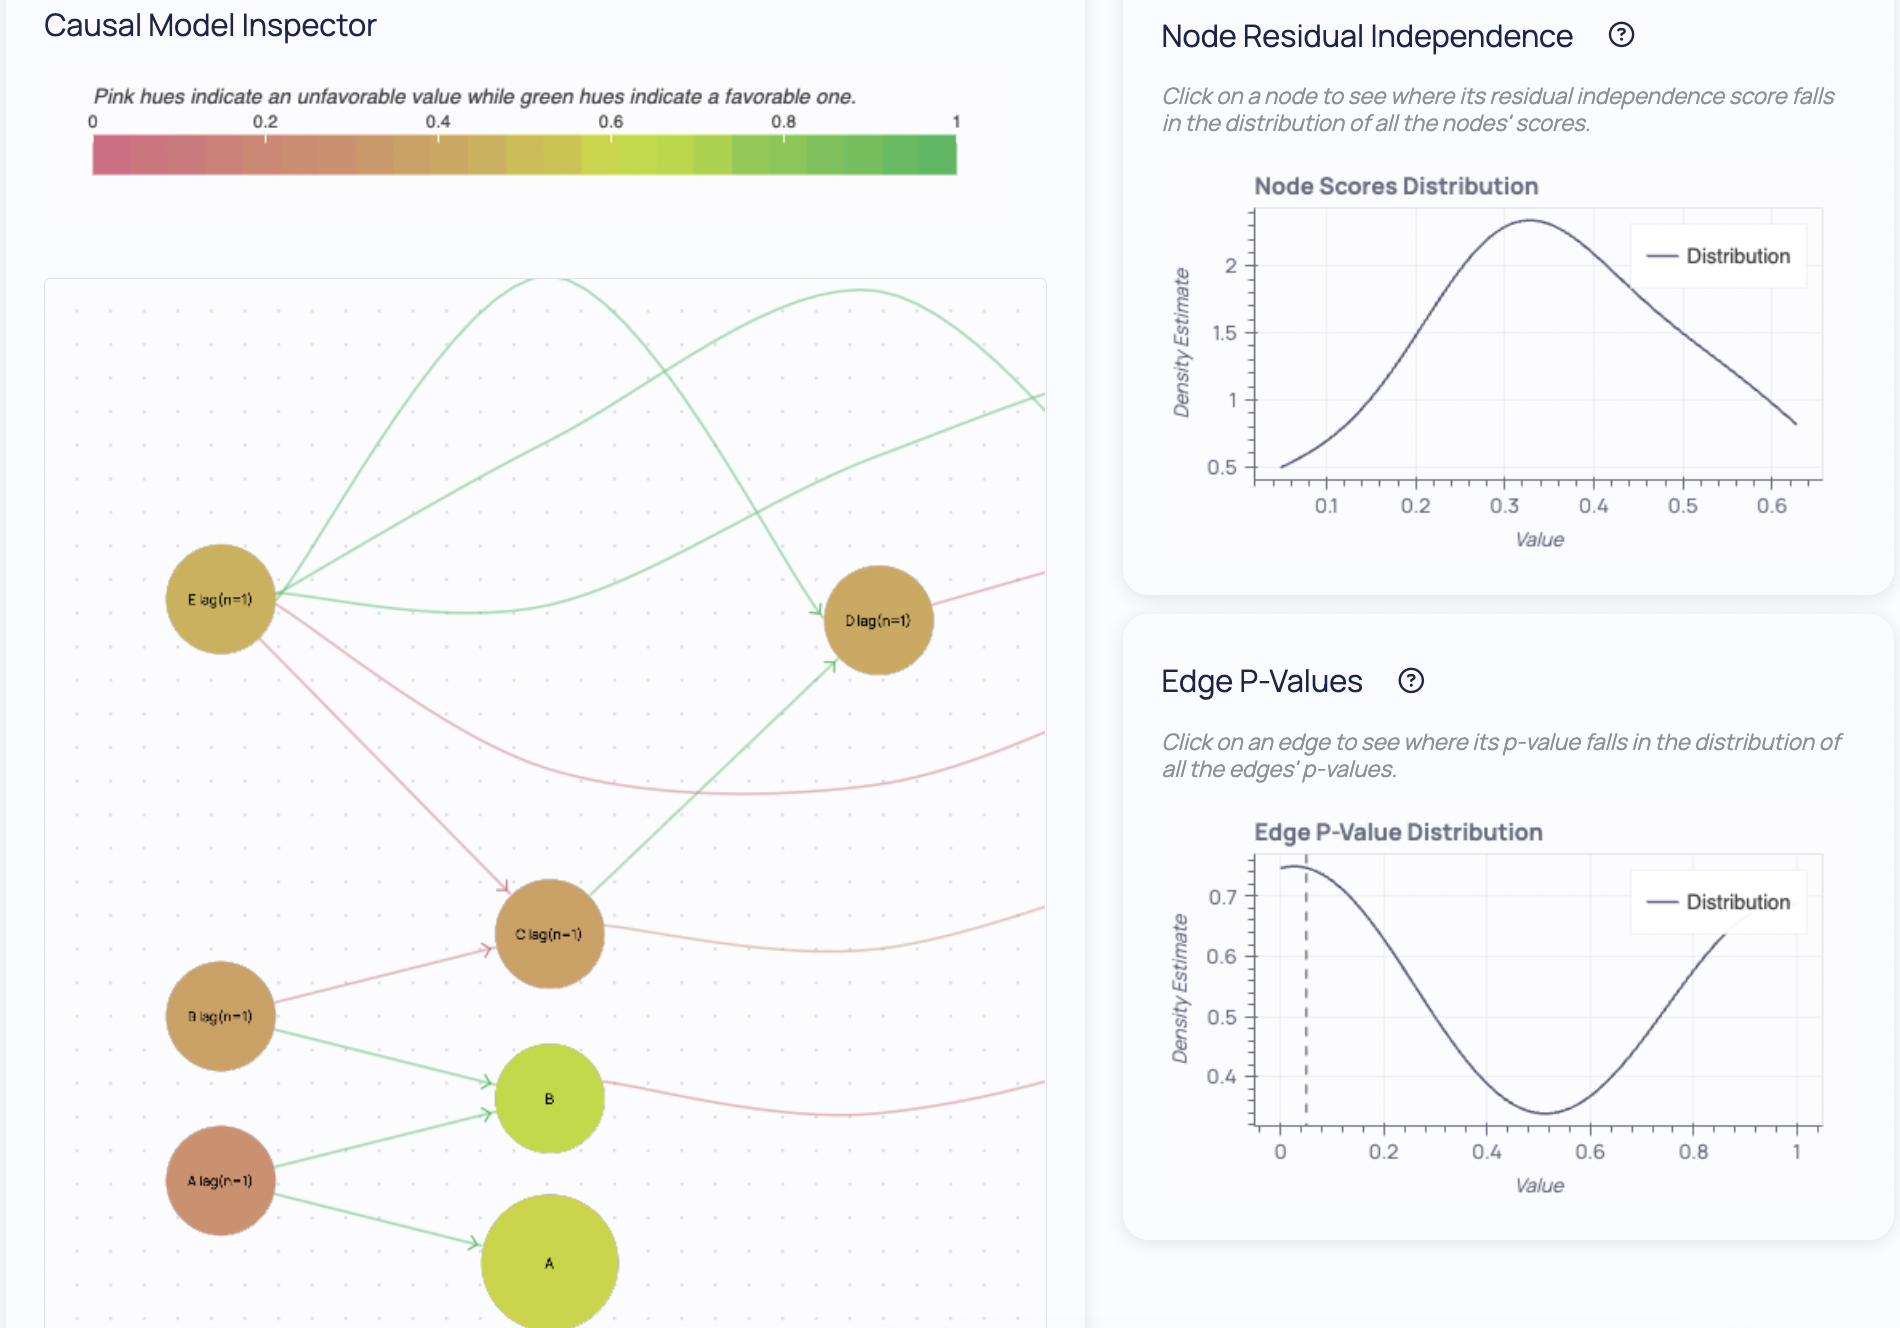
Once a causal graph has been discovered, users can fit structural causal models that capture the functional form between the variables as well as the underlying time-based effects.
- Train with our doubleML package such that each edge is an unbiased estimate of the true causal relationship between source and destination node. Learn more on doubleML here.
- Users have full control over the discovery/fitting process, constraining the activation & aggregation functions as they wish
- Users have access to utility functions specifically made for performing inference on time-series data with structural causal models
- Inspect & evaluate the causal model across time with pre-built visualizations & reports
Accurately estimate the effect of interventions & counterfactuals
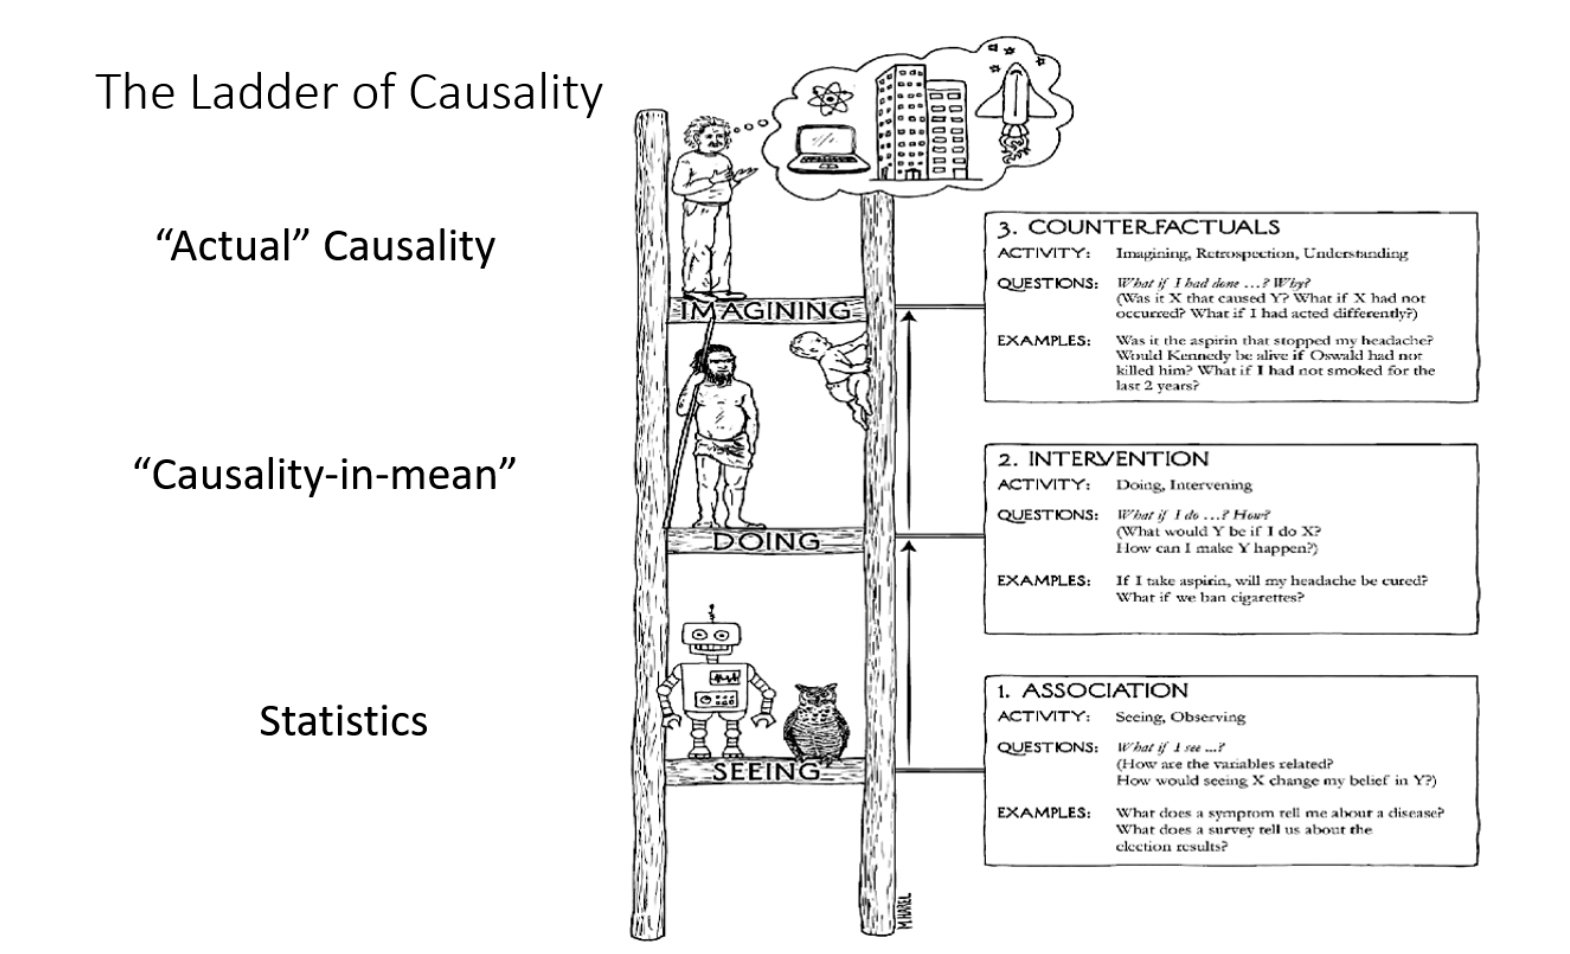
Counterfactual scenarios in a time-series setting can help answer crucial questions like what would happen to sales if the marketing campaign was launched on a different date or if there be a defect if a specific valve did not fail earlier.
We maintain a consistent interface, allowing for the seamless execution of counterfactual & interventional analyses on a time-series model.
Go from models to trusted decision workflows
Our 4 flagship decision intelligence engines, decision optimization, root cause analysis, causal fairness
and Causal Effect can be natively applied to time-series data, taking time-based effects into account.
Notably:
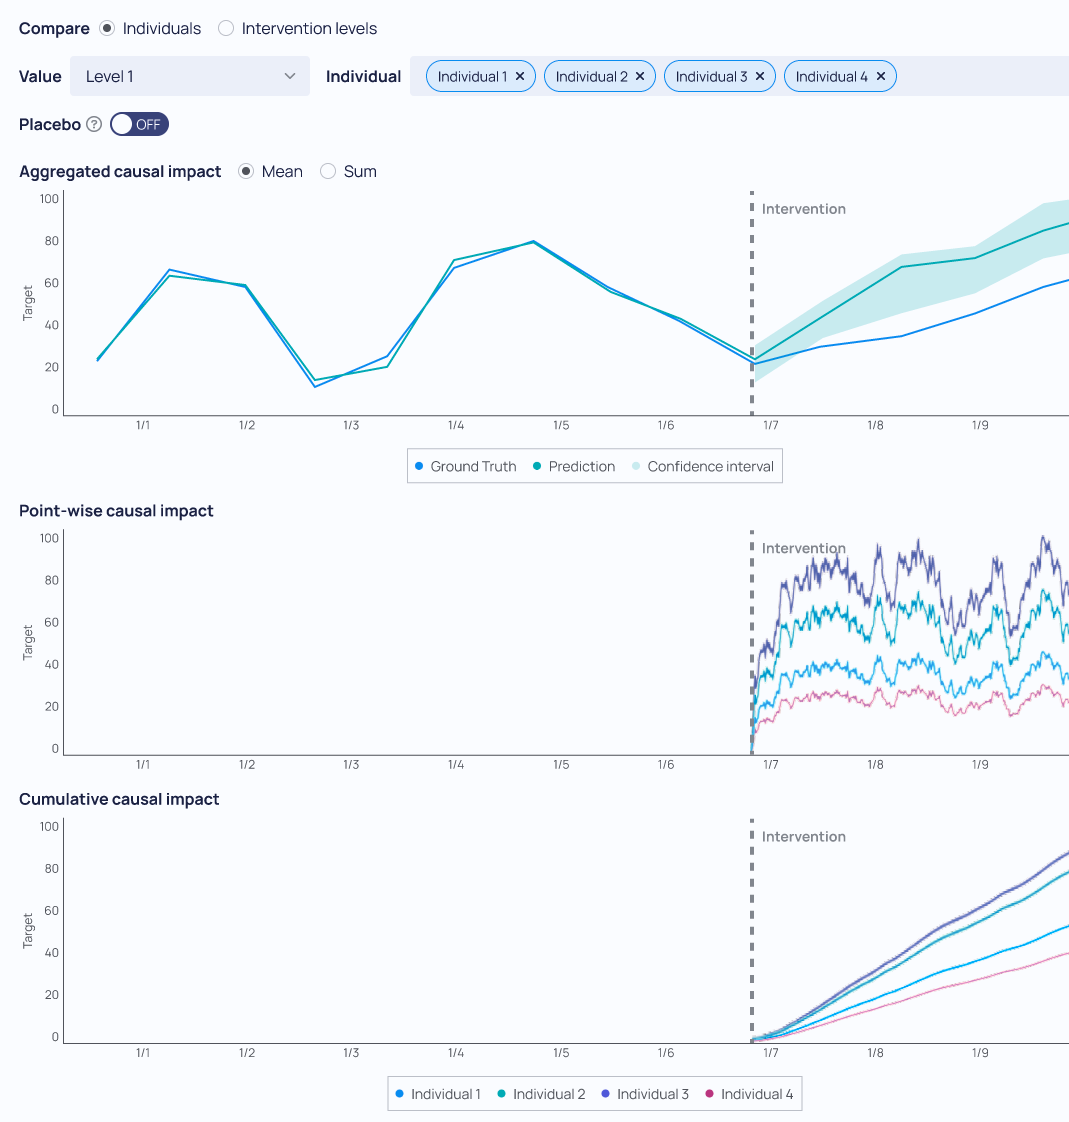
- World class synthetic control/synthetic intervention decision intelligence engine can attribute treatment effect of an intervention over time using a broad array of techniques
- The root cause analysis engine attributes faults to events & variables taking temporal causation into account, wherein the failure of a singular component may precipitate a delayed failure in a downstream component elsewhere
- Users can estimate the impact of an intervention on a time-series. For example how much did a new advertising campaign effect the product sales?
Uncertainty intervals are supported out-of-the-box
Identify changes in the causal structures of your data
A regime shift is a change in the underlying data generating process. For example, a regime shift can occur when a new causal relationship is introduced, when an existing causal relationship is removed or where an existing causal relationship is strengthened or weakened.
Causal AI modeling is uniquely placed to identify true, structural changes of regimes and identify the reason behind them.
- Can be applied to both a structural causal model as well as a causal graph.
- Identifies both local regime shifts, i.e. regime shifts that occur in a small window of the data, as well as global ones.
- In production setting, our packages flag the need for retraining in real-time.
